Examples
Copy-paste recipes. See Parameters for what each flag does.
Basic SE run (everyday settings)
./rnamotifs my_exons.txt -n MYRBP -g hg19 -b 1000 -c 8From rMATS (let RNAmotifs build the labels)
./rnamotifs SE.MATS.JC.txt --from-rmats \
    --rmats-incl 0.1 --rmats-fdr 0.05 \
    -n MYRBP -g hg19 -b 1000 -c 8
Stricter inclusion cutoff:
./rnamotifs SE.MATS.JC.txt --from-rmats --rmats-incl 0.15 --rmats-fdr 0.05 \
    -n MYRBP -g hg19 -b 1000 -c 8
Looser clustering, broader enrichment window
For a sparse motif with dispersed sites:
./rnamotifs my_exons.txt -n MYRBP -g hg19 -w 25 -m 3 -e 100 -b 1000 -c 8High-precision final run
./rnamotifs my_exons.txt -n MYRBP -g hg19 -b 10000 --p-empirical 0.00005 -c 8Mouse (different genome)
bash genomes/mm9.download.sh           # once
./rnamotifs nova_exons.txt -n NOVA -g mm9 -b 1000 -c 8
Parameter search (don't guess hw/ew)
Use the MaRs discovery mode to search parameters per RBP — see RNAmotifs-MaRs.
Visualizing the output
Two worked examples, one per mode. Both use the small inputs shipped in examples/, and both produce a figure you can compare against the copy checked into the repo. Every command below runs verbatim from the repo root with relative paths.
A. rnamotifs — the NOVA splicing map
Input — examples/NOVA_input.txt (mm9, 4368 exons). One exon per line, nine ;-separated columns and no header:
1;149;chr1;+;37429265;37431118;37431134;37434423;2.67
2;302;chr1;+;65238869;65239109;65239140;65242230;5.45
3;316;chr1;+;66448096;66463307;66463440;66466709;2.1
The columns are row_id;second_id;chrom;strand;upstream_exon_end;exon_start;exon_end;downstream_exon_start;dIRank (see Input format). The last column is the regulation label: this set has 98 enhanced (dIRank ≥ 1), 70 silenced (≤ -1) and 4200 control exons.
Command (mm9 genome must be downloaded once; ≈3 min on 10 cores at -b 1000):
bash genomes/mm9.download.sh          # once, if you don't already have mm9
./rnamotifs examples/NOVA_input.txt -n NOVA -g mm9 -b 1000 -c 10
This writes the splicing-map PDF into the run's results directory as MRMs_NOVA_..._nBoot-1000.pdf. A rendered copy is checked in so you can look at it without running anything:
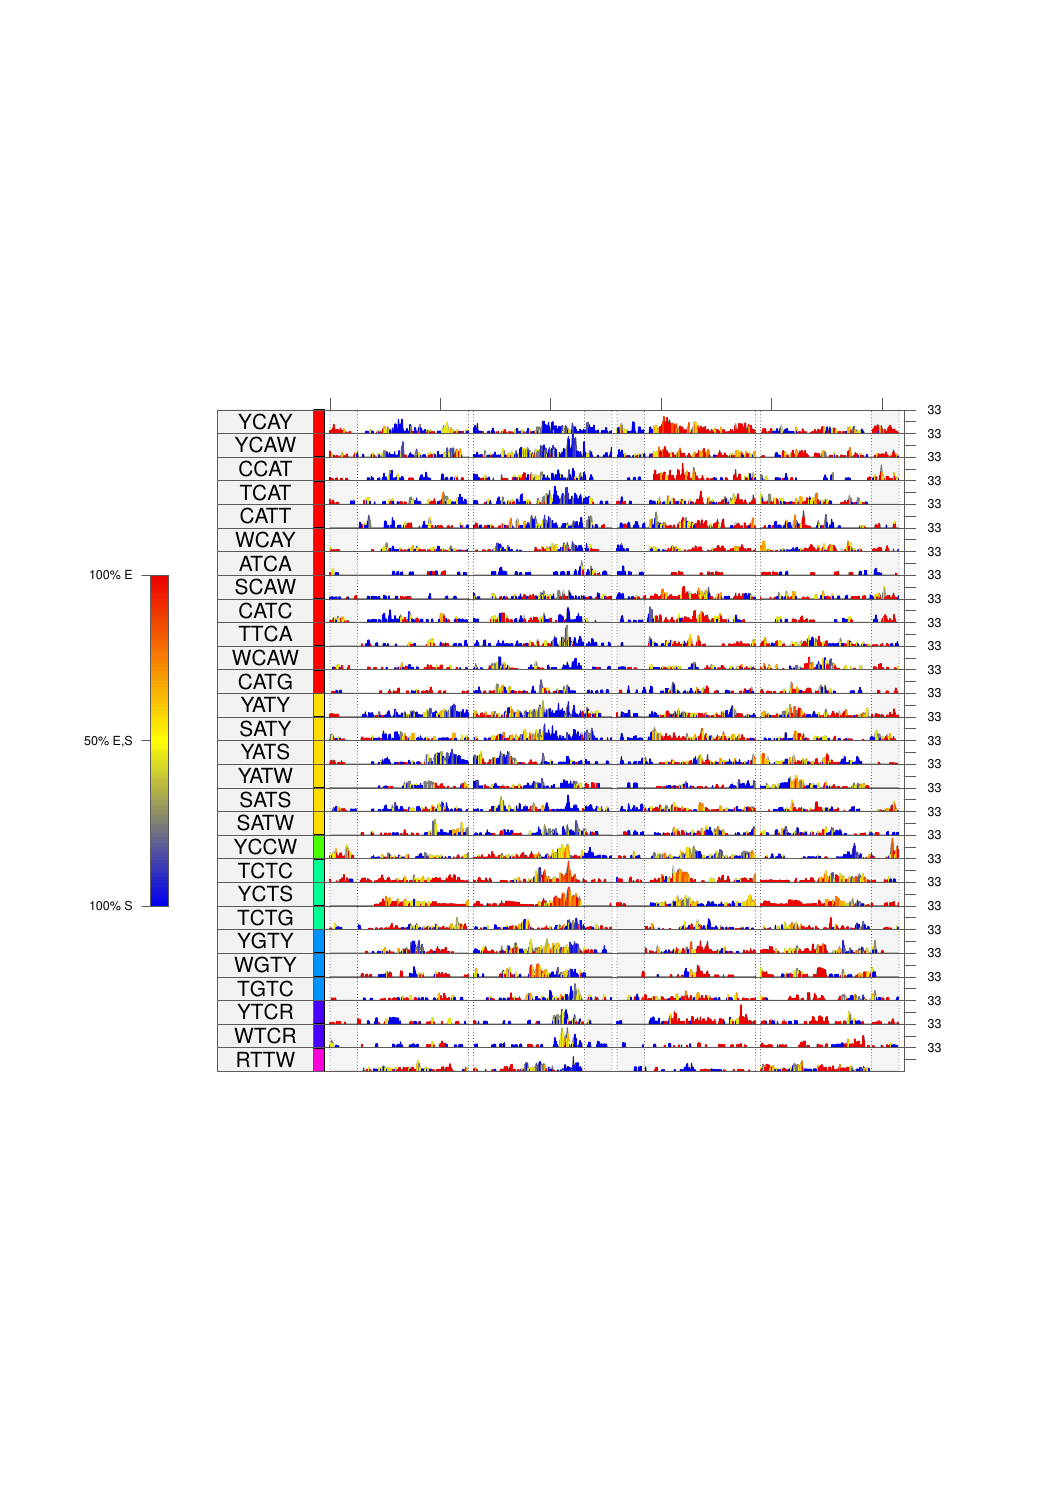
(full-resolution PDF: examples/NOVA_splicing_map.pdf)
How to read this map. Each row is one enriched multivalent RNA motif (MRM), labelled by its tetramer/IUPAC seed (YCAY, TCAT, CATG, …). The panel on the right is a positional profile spanning the regulated exon and its flanking intronic windows: for every row it shows where that motif's clusters sit relative to the exon, drawn upward/red where the motif is associated with enhanced inclusion and downward/blue where it is associated with silencing. The coloured bars and grouping on the left sort the rows by that enhanced-vs-silenced tendency.
The top block is dominated by the YCAY family — the canonical NOVA binding motif — and its red clusters fall in the intron downstream of the regulated exon, while silencing-associated motifs cluster upstream. That positional split (downstream YCAY → inclusion, upstream YCAY → skipping) is recovered here from sequence and the regulation labels alone, and recapitulates the experimentally derived NOVA splicing map.
B. rnamotifs-mars — the PTBP1 association map
Input — examples/HepG2_PTBP1_input.txt: the ENCODE PTBP1 regulated-exon set in HepG2 (hg19, 5663 exons; 30 enhanced, 99 silenced, the rest control). Same nine-column format as mode A:
1;13151;chr2;+;159530512;159533250;159533379;159535092;-1
2;16035;chr15;+;63353472;63353911;63353987;63354413;-1
3;18400;chr11;+;46681035;46686398;46686509;46686932;-1
The MaRs mode couples the RNAmotifs motif search with eCLIP RBP-binding data and ranks candidate RBPs by how well the discovered motifs match each RBP's binding profile — the MRM–RBP association score (see RNAmotifs-MaRs for the flags and the eCLIP inputs it needs).
The figure below is a static illustration of the resulting association map for this PTBP1 set (checked in as examples/HepG2_PTBP1_association_map.png):
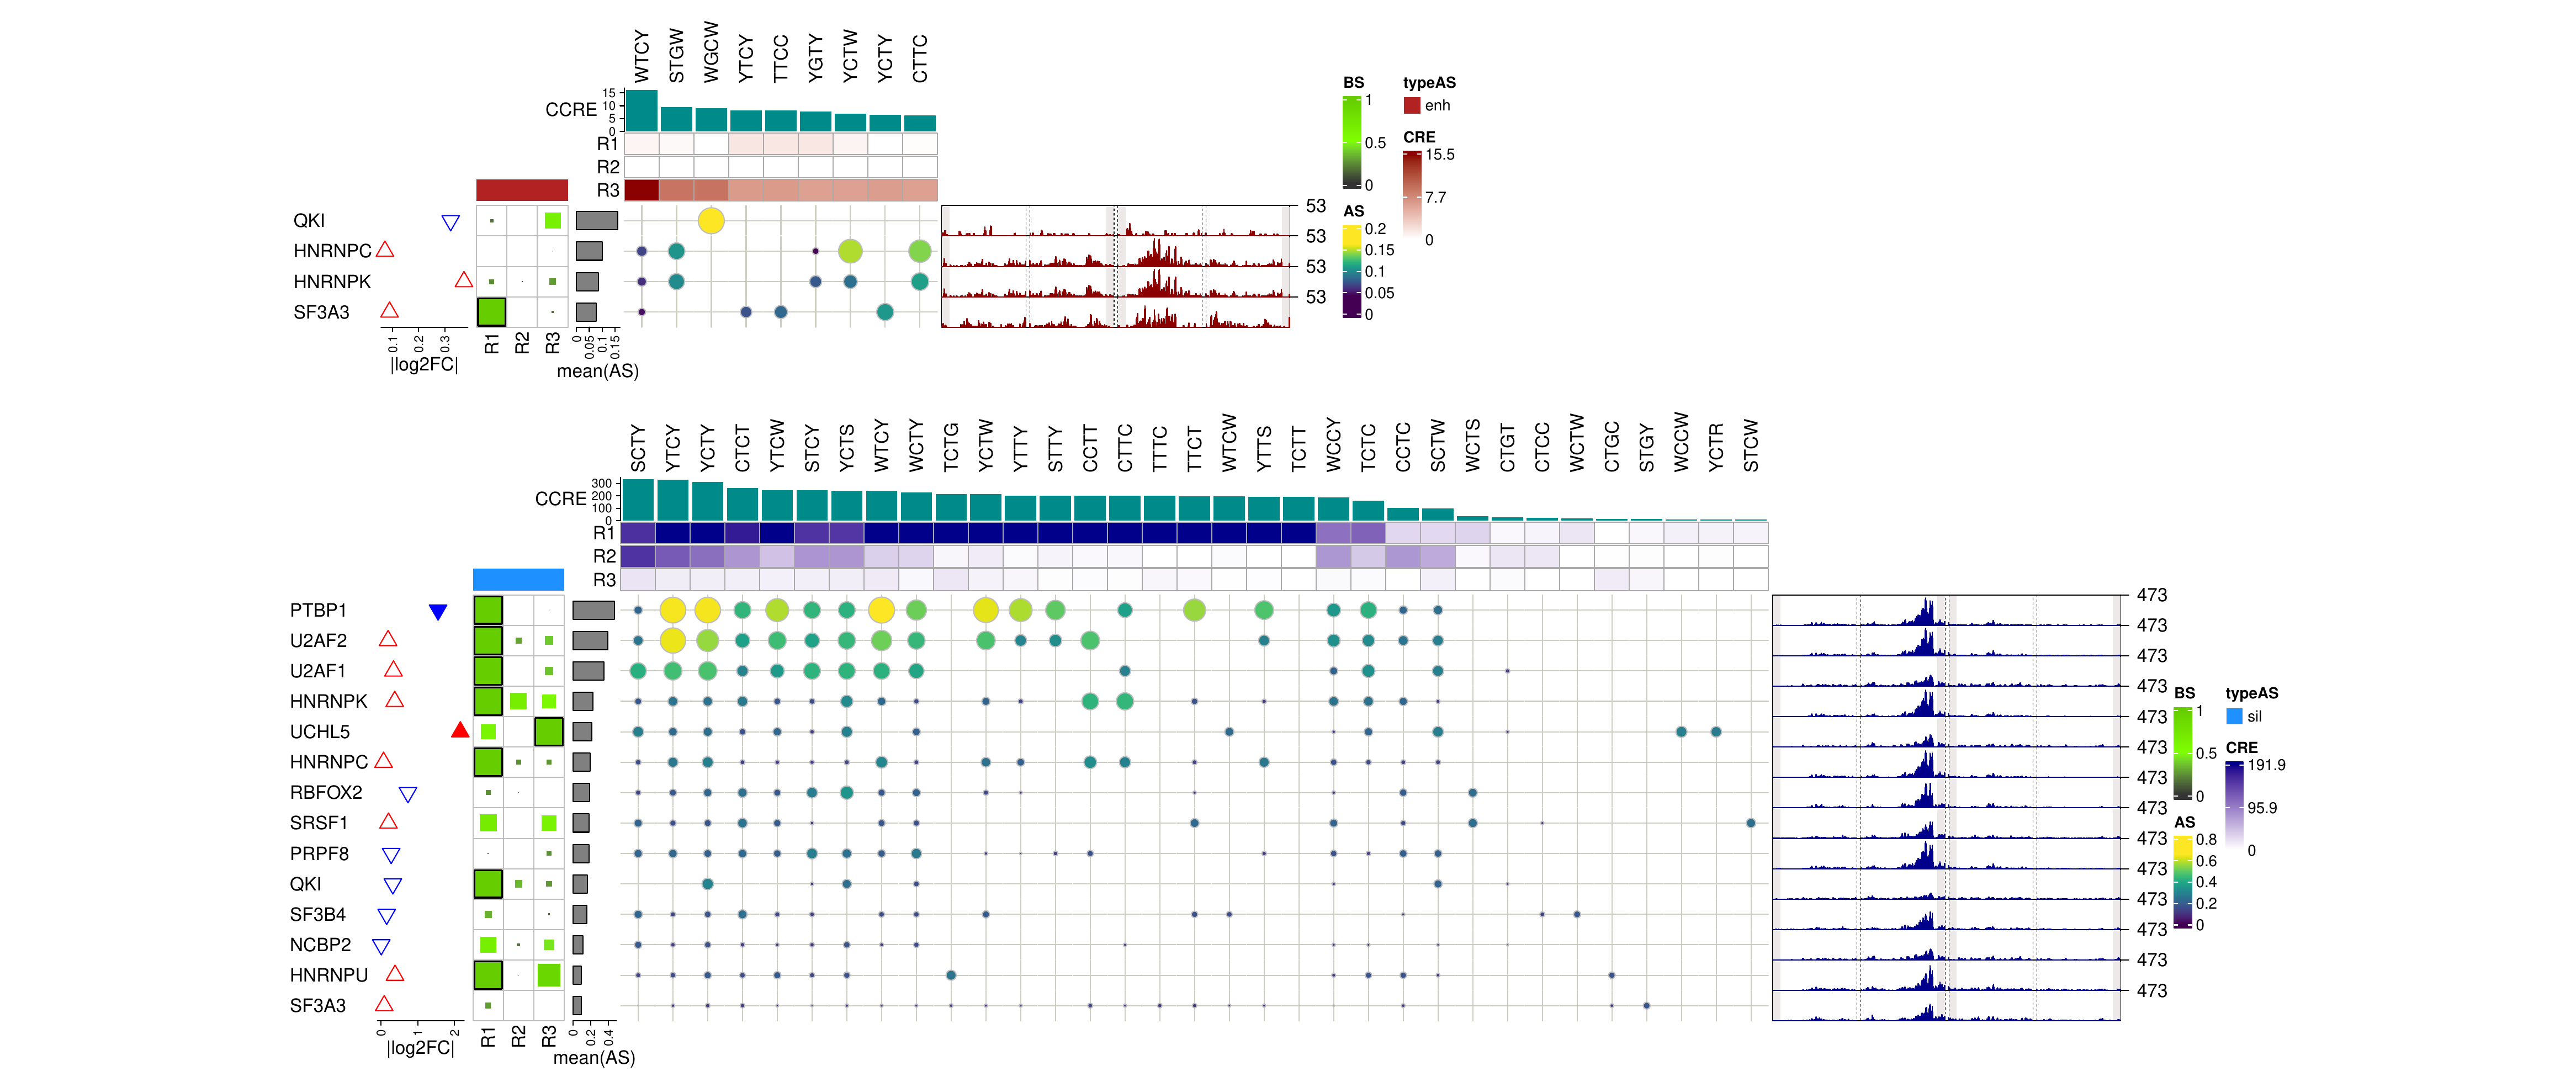
How to read this map. The map is split into two blocks: an enhanced block (top) and a silenced block (bottom). In each block, rows are candidate RBPs ranked from best-matching downward, and columns are the enriched MRMs; every dot encodes the MRM–RBP association (size and colour scale with the association score). The stacked profiles on the right are the per-RBP positional splicing maps for that block (red for the enhanced block, blue for the silenced block).
Because PTBP1 represses inclusion, its regulated exons are silencing-dominated, and PTBP1 sits at the top of the silenced block — the strongest match to its own binding motifs. It is the positive control: the method rediscovers the correct RBP for its own perturbation set.
Which mode to use
Use rnamotifs when you have one splicing dataset and want the cis picture — which motifs are enriched and where they sit relative to the exon. Use rnamotifs-mars when you also have RBP-binding (eCLIP) data and want the trans question answered — which RBP best explains a set of regulated exons, ranked against a panel. Mode A needs only a genome; mode B additionally needs the eCLIP reference described in RNAmotifs-MaRs.
🚧 Work-in-progress examples
The following features are implemented but not yet validated; commands are shown for reference only and their output should be treated as experimental:
# Intron retention (WIP)
./rnamotifs RI.MATS.JunctionCountOnly.txt --from-rmats --event-type RI \
    --rmats-incl 0.1 --rmats-fdr 0.1 -n MYRBP_RI -g hg19 -b 1000 -c 4

# Structure + conservation (WIP; need ViennaRNA / PhyloP data)
./rnamotifs nova_exons.txt -n NOVA -g mm9 \
    --structure --structure-window 31 --conservation -c 12